
Running a Dedicated Idena Node

I joined the Idena ecosystem not so long ago.
Idena is a proof-of-identity blockchain which lets users in based on invites from existing members, and then demands every user re-verify their humanity based on a captcha-like task once or twice per month.
All verified users get a reward from the chain every month, and by keeping this verification window very short, and by scheduling it to be at the same time in the whole world, the threat of Sybil attacks is minimized.
It's a fun proof of concept, and something I want to explore porting to Substrate later, as Idena would perform much better as a Substrate-based chain - not least because of actual on-chain governance, and not the non-binding governance it's using now.

In the meantime, I wanted to set up a dedicated node for it because the default app with the built-in node they're distributing leaves something to be desired.
Notably, if you activate mining mode - this is when you stake some funds to earn more in the periods between verifications - you're at risk of getting slashed (losing some money you stake in the protocol in mining mode) if your node crashes, your computer turns off, or any other calamity befalls you. There are no alerts to keep you informed, so you have to keep checking back.
Edit: you don't actually get slashed, you just accrue a penalty which you repay into the future by mining for free. Thanks to Karpaty on Reddit for the correction.
Running a dedicated node on a stable server is the right way™, so that the application can just connect to this more stable remote node. The official docs like to recommend cloud servers and VPS, but you know me, I'm 100% against cloud and running of any kind of decentralized protocol on highly centralized cloud services, so I'll be setting this up on one of my local servers in the office.
Prerequisites
Use Linux. I use Ubuntu 18.04 and 20.04. on my servers.
Install Prometheus and Grafana if you want to be able to monitor the node. This guide from the Web3 Foundation is great for that.
I will also make the following assumptions:
- you have either direct access to your server or you can SSH into it
- your account can do
sudo
Install and Sync Idena
While logged into the server, we execute:
wget https://github.com/idena-network/idena-go/releases/download/v0.21.7/idena-node-linux-0.21.7
This downloads Idena's current release into the current folder. Change the release version number according to the latest release here. Rename this file to idena-go for ease of use.
mv idena* idena-go
Run ./idena-go and let it sync. Depending on the hard drive you're using, it should not take more than a few hours. A synced node looks like this:
INFO [08-20|09:35:57.475] Selected proposer                        proposer=0xaCaF0Ea28c8679D030Cf7F4399eFD5C40bC3518E
INFO [08-20|09:35:57.481] Wait for block proposal
INFO [08-20|09:35:57.481] Reduction started                        block=0x0149cd7ec3c8cc366e735913bb03828f188a6a1978b8ea963b17536100b49c8d
INFO [08-20|09:35:58.992] Reduction completed                      block=0x0149cd7ec3c8cc366e735913bb03828f188a6a1978b8ea963b17536100b49c8d isEmpty=false
INFO [08-20|09:35:58.992] binaryBa started                         block=0x0149cd7ec3c8cc366e735913bb03828f188a6a1978b8ea963b17536100b49c8d
INFO [08-20|09:36:00.390] Reached FINAL                            block=0x0149cd7ec3c8cc366e735913bb03828f188a6a1978b8ea963b17536100b49c8d txs=0
INFO [08-20|09:36:00.391] Node is synchronized                     component=downloader
INFO [08-20|09:36:06.628] Start loop                               round=1708129 head=0x0149cd7ec3c8cc366e735913bb03828f188a6a1978b8ea963b17536100b49c8d peers=18 online-nodes=2607 network=2985
Notice the "Node is synchronized" message.
Auto-boot
Stop the node with CTRL+C. Let's make it auto-run on boot.
Create a new idena.service file in /etc/systemd/system
sudo vim /etc/systemd/system/idena.service
Then paste in the following content:
[Unit]
Description=idena
Wants=network-online.target
After=network-online.target

[Service]
User=YOURUSER
Type=simple
WorkingDirectory=/home/YOURUSER
Restart=always
RestartSec=30
LimitNOFILE=65535
ExecStart=/home/YOURUSER/idena-go --apikey "YOURAPIKEY" --verbosity 5 --rpcaddr 0.0.0.0 --config=/home/YOURUSER/idena/config.json

[Install]
WantedBy=multi-user.target
Replace YOURUSER with the user you want to run Idena as, and YOURAPIKEY with the key value you want to require for connecting to this node's RPC endpoints.
We need to create the home/YOURUSER/idena/config.json file with the following content:
{ "RPC": {
  "HTTPVirtualHosts": ["*"]
}}
This is needed if you named your server, so you can connect to the node via something like http://myservername rather than https://192.168.1.10.
The node will now start automatically on every OS boot and whenever it crashes, provided more than 30 seconds have passed. The 30 second buffer is there to prevent the restarting node from interfering with unclosed file handles and other artifacts of the crash.
You can now stop the node with systemctl stop idena, start it with systemctl start idena, restart with systemctl restart idena, and check its status with systemctl status idena.
Connect the App
At this point, the RPC connection of the node will be publicly exposed and you should be able to connect to it. As a test, in a terminal on another machine on the same network, execute telnet IP_OF_MACHINE_RUNNING_THE_NODE 9009
This should connect successfully. Disconnect by pressing enter.
To test that the RPC interface is operating correctly, on the machine running the node execute:
curl -X POST -H 'content-type:application/json;' http://0.0.0.0:9009 --data @- << EOF
{
 "method": "dna_epoch",
 "id": 2,
 "params": [],
 "key": "YOURAPIKEY"
}
EOF
This should produce a result like:
{"jsonrpc":"2.0","id":2,"result":{"epoch":52,"nextValidation":"2020-08-29T15:30:00+02:00","currentPeriod":"None","currentValidationStart":"2020-08-29T15:30:00+02:00"}}We can now connect the app. In the Settings screen of the app, disable the built in node and activate the remote node option. For the node address, you can use an IP address even if your local server has a name, or the server's name because we set up the config.json file above.

RPC Interaction
To interact with the node through RPC calls, you can also try this tool. Clicking Change at the top of the screen will let you input the same settings you would input in the app, but this lets you explore the full list of RPCs on offer.
Import Account
Every Idena node generates its own account when it starts up. This means connecting to this new node will give you a completely different identity. If you have an Idena identity from before, you need to migrate it.
On Windows, the default location of the key is in %userprofile%\AppData\Roaming\Idena\node\datadir\keystore
On Linux, it's datadir/keystore/nodekey
On OS X it's ~/Library/Application\ Support/Idena/node/datadir/keystore
Copy the nodekey file from any of these locations, and place it in the appropriate location in your destination, overwriting the one that's there. Restart the node for the new key to be loaded.
Set up Monitoring: Prometheus
Idena currently has no Prometheus metrics exposed in its code, which means we can't bind Prometheus directly to it. There is a tool called node-exporter which exposes a lot of system metrics to Prometheus, among them systemd information. Systemd is the system daemon manager which we use to start and stop Idena, and to check for its status.
We install node-exporter by executing:
wget https://github.com/prometheus/node_exporter/releases/download/v1.0.1/node_exporter-1.0.1.linux-amd64.tar.gz
tar -xzf node_exporter*
sudo mv node_exporter*/node_exporter /usr/local/bin/node_exporter
rm node_exporter*
Note that you should always use the most recent release - find out which one it is by looking at the releases page.
For security, let's create a special user under which we'll run this service.
sudo useradd --no-create-home --shell /bin/false nodeexporterThe node exporter tool serves its data on port 9100 by default, so in /etc/prometheus/prometheus.yml we need to change the targets line under static configuration:
static_configs:
  - targets: ['localhost:9090', 'localhost:9100']
Restart Prometheus after changing this with sudo systemctl daemon-reload && systemctl restart prometheus.
The node exporter tool works with collectors which collect specific metrics from the system. The systemd collector is disabled by default, so we need to add the --collector.systemd flag when running the exporter. With that in mind and our user created, we can build the service in /etc/systemd/system/node_exporter.service.
[Unit]
Description=Node Exporter
Wants=network-online.target
After=network-online.target

[Service]
User=nodeexporter
Group=nodeexporter
Restart=always
Type=simple
ExecStart=/usr/local/bin/node_exporter --collector.systemd

[Install]
WantedBy=multi-user.target
Load the service and start node_exporter:
sudo systemctl daemon-reload && systemctl restart node_exporter
If we now visit the Prometheus UI, we can query for Idena's current status by entering node_systemd_unit_state{name="idena.service"}.
The output should be something like this - notice the "1" on the "active" state:

Set up Monitoring: Grafana
Finally, we're ready to set up a dashboard. Open your Grafana instance and log in - if you've never logged in before, the user/pass combination is admin/admin.
In the left sidebar, go to Data sources and add the Prometheus data source.

The default settings should be fine - I personally reduce the scrape interval slightly to 10s, and if you named your server you should put the name instead of localhost into the URL field.
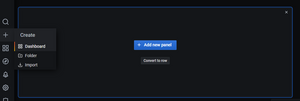
In the left sidebar click the + icon and select Dashboard to create a new dashboard. You will see an empty frame with the button "Add new panel".
Let's set the panel up:
- Under Metrics, put the query
node_systemd_unit_state{name="idena.service"}. - Under Panel in the right sidebar rename the panel to "Idena Status" in Settings
- Pick Stat as Visualization
- Under Display select only the "active" field under "Fields" (it should be the second option from the top)
- Set Color mode to Background
- For the Calculation, make sure the value is set to Last.
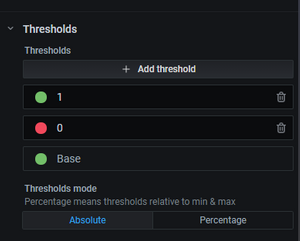
In the same sidebar, go to the Field tab and there make two thresholds: a green one with the value 1, and a red one with the value 0.
Apply and save, and you should have a green tile on your dashboard indicating the uptime status of your Idena node along with the graph of the last X hours (set X by changing the option in the top right corner).

Finally, let's get rid of the 1 and do something more descriptive. Edit the same panel again, but this time go to the Overrides tab. Set an override for the active state with two value mappings: the first one should set the range of anything below 1 to DOWN, and the second one should rename 1 to UP.

Apply and save, and you should see a green UP message in the tile now.

And if you kill the node, the tile should almost immediately change to a red DOWN.

What about Mining?
Mining is done through the Become Online RPC call. When you click "Mine" in the app, the app sends an RPC call to the node telling it to "Become Online". This means that if your app crashes, your node will keep mining. Your app is now just a shell reading the status of the node - its instability can no longer put your account at risk, and neither can Windows updates, computer crashes, or other problems.
Appendix: Security
The official recommendation is to set up a tunnel connection, a manual port forward to connect to your node. In an environment where you're in control of the servers, this is not necessary, but we do need to take precautions because our RPC endpoints are now exposed to the public internet.
Granted, your server can't easily be reached if the 9009 port isn't forwarded directly to it, so you're relatively safe as is, but we can turn it up a notch.
We'll use iptables to block access to port 9009 from all IP addresses other than our local area network.
sudo iptables -A INPUT -p tcp --dport 9009 -s 192.168.0.0/24 -j ACCEPT
sudo iptables -A INPUT -p tcp --dport 9009 -s 127.0.0.0/8 -j ACCEPT
sudo iptables -A INPUT -p tcp --dport 9009 -j DROP
If your subnet is anything other than 0, meaning your local machine's IP address is, for example, 192.168.5.30, then change the first line to match: 192.168.5.0/24.
This tells iptables to accept all traffic to port 9009 from your LAN and from the machine it's running on, but to silently black-hole all other packets coming in.
iptables resets all rules after reboot, so to persist them install a tool that does that for you:
sudo apt-get install iptables-persistent
Now the rules will be re-applied after every reboot.
If this guide helped you, consider sending me a DNA tip to 0x33bea4764a6e96f0792681605575f5b1ceb56b6c - stay tuned for more guides and check out my other writeups on Bitfalls.com!
Comments
comments powered by Disqus